Beginner’s Guide to Zabbix: Easy Steps for Installation and Configuration
Hey there, tech enthusiasts! 👋 Are you ready to dive into the world of monitoring with Zabbix? Whether you’re a budding system administrator, a curious developer, or just someone fascinated by the intricate world of network and server monitoring, you’re in the right place.
So, what exactly is Zabbix? 🤔 Zabbix is an open-source monitoring software tool. But it’s not just any tool; it’s a powerful, versatile solution for monitoring your entire IT infrastructure, applications, services, and resources. Think of it as your one-stop-shop for keeping an eye on your network’s health, performance, and security.
What makes Zabbix stand out? Here are a few highlights:
- It’s Open-Source: That’s right, Zabbix is free! 🆓 You get a robust monitoring solution without the hefty price tag. And being open-source means a community of developers constantly works to improve it.
- Super Scalable: Whether you’re monitoring a small home network or an enterprise-level system, Zabbix scales beautifully. It grows with your needs, so you don’t have to worry about outgrowing it.
- Real-Time Monitoring: With Zabbix, you get real-time monitoring of your servers, network devices, and more. This means you can catch issues 🔥 as they happen, not after the fact!
- Flexible and Customizable: One size doesn’t fit all, and Zabbix gets that. You can customize it to monitor exactly what you need, the way you need it.
- Strong Community Support: Have questions? Need help? The Zabbix community is active and always ready to lend a hand. Plus, there’s a wealth of documentation available.
But wait, there’s more! Zabbix isn’t just about keeping an eye on things; it’s about making your life easier. It can predict trends, send alerts when things go sideways, and even automate tasks to fix problems. Pretty neat, right?
In the upcoming sections, we’ll walk through the steps to get Zabbix up and running. We’ll cover everything from installation to basic configuration, and by the end, you’ll be a Zabbix pro! So, grab your favorite beverage ☕, and let’s get started on this exciting journey! 🚀
Installation Process
Alright, let’s roll up our sleeves and jump into the installation process of Zabbix. 🛠️ Don’t worry, I’ll guide you through each step so that you can follow along easily, even if you’re new to this. We’ll focus on installing Zabbix on a Linux environment, which is a common choice for many users. Ready? Let’s get started!
1. Choose Your Linux Flavor
First things first, you need to decide on the Linux distribution you want to use. Zabbix supports several popular distributions like Ubuntu, CentOS, and Debian. For this guide, let’s pick Ubuntu, which is user-friendly and great for beginners. 🐧
2. Update Your System
Before we dive into installing Zabbix, make sure your system is up-to-date. Open your terminal and run:
sudo apt update
sudo apt upgrade
This ensures that you have the latest security patches and software updates. Safety first, folks! 🔐
3. Install Zabbix Server
Now, it’s time to install the Zabbix server. Zabbix provides packages for easy installation. Execute the following commands:
wget https://repo.zabbix.com/zabbix/5.0/ubuntu/pool/main/z/zabbix-release/zabbix-release_5.0-1+ubuntu20.04_all.deb
sudo dpkg -i zabbix-release_5.0-1+ubuntu20.04_all.deb
sudo apt update
These commands download and install the Zabbix repository. We’re using Zabbix 5.0 here, but make sure to check for the latest version.
4. Install Zabbix Components
Once the repository is set up, install Zabbix server, frontend, and agent:
sudo apt install zabbix-server-mysql zabbix-frontend-php zabbix-apache-conf zabbix-agentThis command will install the Zabbix server (which collects data), the frontend (the web interface), and the Zabbix agent (which monitors local resources on the Zabbix server).
5. Set Up the Database
Zabbix needs a database to store its data. Let’s set up a MySQL database:
sudo apt install mysql-server
sudo mysql_secure_installation
After installing MySQL, create a database and user for Zabbix:
sudo mysql -u root -p
create database zabbix character set utf8 collate utf8_bin;
grant all privileges on zabbix.* to zabbix@localhost identified by 'yourpassword';
flush privileges;
exit;
Remember to replace ‘yourpassword’ with a strong password.
6. Import Initial Schema and Data
Now, import the initial schema and data for Zabbix:
zcat /usr/share/doc/zabbix-server-mysql*/create.sql.gz | mysql -uzabbix -p zabbixYou’ll be prompted to enter the password you created for the Zabbix database user.
7. Configure the Zabbix Server
Edit the Zabbix server configuration file to specify the database:
sudo nano /etc/zabbix/zabbix_server.confIn this file, find and update the following lines with your database details:
DBHost=localhost
DBName=zabbix
DBUser=zabbix
DBPassword=yourpassword
8. Restart and Enable Zabbix Server
After configuring, restart the Zabbix server and make it start at system boot:
sudo systemctl restart zabbix-server zabbix-agent apache2
sudo systemctl enable zabbix-server zabbix-agent apache2
9. Configure the PHP for Zabbix Frontend
Edit the PHP configuration for Zabbix:
sudo nano /etc/zabbix/apache.confModify the php_value date.timezone line to match your time zone.
10. Accessing Zabbix Frontend
Finally, open your web browser and go to http://your_server_ip_or_domain/zabbix. You should see the Zabbix setup wizard. Follow the steps to complete the setup.
And voilà! 🎉 You have successfully installed Zabbix on your system. Now, you’re ready to dive into the world of efficient IT infrastructure monitoring with Zabbix.
Initial Configuration
Great job getting Zabbix installed! 🌟 Now, let’s walk through the initial configuration to get your Zabbix setup tailored to your needs. This part is crucial because it sets the foundation for how Zabbix will operate in your environment. So, let’s get to it!
1. Completing the Zabbix Setup Wizard
After navigating to your Zabbix server’s web interface (http://your_server_ip_or_domain/zabbix), you'll be greeted by the Zabbix setup wizard. This user-friendly interface will guide you through the rest of the setup.
- Welcome Screen: Simply click “Next Step” to proceed.
- Check of Pre-requisites: Here, Zabbix will check if your server meets all the requirements. If any items are marked in red, you’ll need to fix them before proceeding. Most issues at this stage are related to PHP settings.
- Configure DB Connection: Enter the database details you used earlier. This includes the database name, user, and password.
- Zabbix Server Details: You can generally leave these settings as default. If your server has a specific name or IP address you want to use, enter it here.
- Pre-Installation Summary: Review your settings. If everything looks good, go ahead and click “Next Step.”
- Install: The wizard will now set up Zabbix based on your configurations. Once done, you’ll see a “Congratulations” screen.
2. Logging into Zabbix
With the installation complete, it’s time to log in:
- Go to the Zabbix login page (
http://your_server_ip_or_domain/zabbix/index.php). - Use the default login credentials: Username:
AdminPassword:zabbix
Remember, security first! 🔒 Change the default password as soon as you log in. Go to the “User profile” section and set a new, strong password.
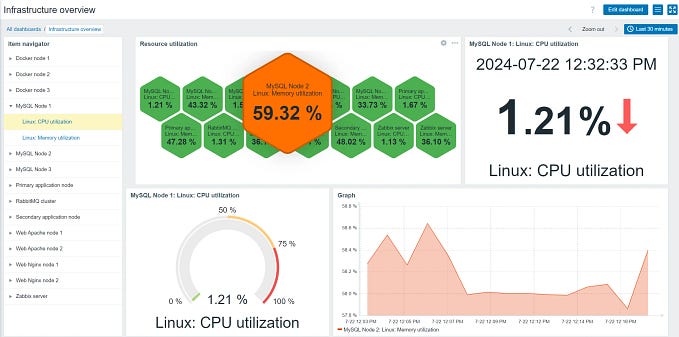
3. Configuring the Zabbix Dashboard
Your Zabbix dashboard is the command center where you’ll monitor everything. Spend some time familiarizing yourself with the interface. Here are a few key areas to explore:
- Monitoring: Check real-time data from your network and server.
- Configuration: This is where you’ll spend a lot of time setting up hosts, items, triggers, and more.
- Reports: Useful for analyzing trends and problem areas.
- Administration: Manage users, user groups, and system settings.
4. Adjusting System Settings
Dive into the “Administration” tab:
- User Groups: Define user groups with different permissions. This is especially useful if you have a team.
- Users: Add or edit users and assign them to groups.
- General Settings: Here, you can adjust various global settings like default language, timezone, and theme.
5. Familiarize Yourself with Zabbix Features
Take some time to explore:
- Hosts: Learn how to add and configure hosts.
- Templates: Understand how templates work and how they can make your life easier.
- Items and Triggers: Get to know these core components of monitoring with Zabbix.
Adding Your First Host
Now that you’ve got Zabbix up and running, it’s time for the exciting part — adding your first host for monitoring! 🌐 A host in Zabbix terminology is any networked device (like a server, router, or switch) you want to monitor. In this section, I’ll guide you through the process of adding a host and setting it up for basic monitoring.
1. Navigate to the Host Configuration Section
- Log into your Zabbix frontend.
- Go to Configuration > Hosts in the top navigation bar. This is where you manage all your hosts.
2. Adding a New Host
- Click on the Create host button (top right corner). This will open the host creation interface.
- Host Name: Enter a descriptive name for your host. This could be anything that makes it easily identifiable.
- Visible Name: Optional. You can provide a different name here, which will be displayed in the Zabbix frontend.
- Groups: Assign your host to a group. Groups help organize hosts and can be used for batch operations and permissions. You can choose an existing group or create a new one.
- Interfaces: This is crucial for communication between the host and the Zabbix server.
- For most scenarios, you’ll be using the ‘Agent’ type.
- Enter the IP address or DNS name of the host.
- Specify the port number (default is 10050).
3. Linking Templates
- Templates are a powerful feature in Zabbix. They contain predefined items, triggers, graphs, etc., for different types of hosts.
- In the Templates tab, you can link one or more templates to your host. For example, if you’re adding a Linux server, you might link a template like “Template OS Linux.”
- Zabbix comes with a number of pre-configured templates, but you can also create your own.
4. Configuring Host Parameters
- Explore other tabs like Applications, Items, Triggers, and Discovery rules for more advanced settings.
- However, for a beginner, the pre-defined parameters in the linked templates are usually sufficient.
5. Monitoring the Host
- Once you’ve configured the host and linked the necessary templates, click the Add button to save your new host.
- Your host will now appear in the list under Configuration > Hosts.
- It may take a few minutes for Zabbix to start collecting data. Once it does, you can view the data under the Monitoring tab.
6. Checking the Host Status
- In the hosts list, a green ZBX icon next to your host indicates that Zabbix is successfully receiving data.
- If it’s red or gray, there might be issues with the configuration or connectivity.
7. Exploring the Data
- Go to Monitoring > Latest data or Graphs to see the collected metrics.
- This is where you can really start to see the power of Zabbix, as you watch real-time data from your host.
Understanding and Using Templates
Templates are at the heart of efficient monitoring in Zabbix. They are incredibly powerful, helping you save time and maintain consistency across your monitoring setup. In this section, I’ll explain what templates are and how you can use them effectively. 🎯
What are Templates in Zabbix?
Think of templates as blueprints for monitoring. A template in Zabbix contains a predefined set of elements:
- Items: Metrics that you want to monitor (like CPU load, disk space, network utilization).
- Triggers: Conditions that define what an “issue” is (like high CPU usage).
- Graphs: Visual representations of your monitoring data.
- Applications: Logical groups for items.
- Discovery rules: Rules for automatic discovery of resources (like hard drives, network interfaces).
Templates are designed to be reusable. You can apply the same template to multiple hosts, ensuring consistent monitoring across devices of the same type. 🔄
Using Predefined Templates
Zabbix comes with a variety of predefined templates for common hardware, applications, and services. Here’s how to use them:
- Accessing Templates: Go to Configuration > Templates. Browse through the list to see what’s available.
- Linking a Template to a Host: When adding or editing a host (under Configuration > Hosts), you can link templates in the Templates tab.
- View Template Elements: Click on a template name to see its items, triggers, graphs, etc. This is a great way to understand what exactly the template is monitoring.
Creating Custom Templates
Sometimes, you might need to monitor something specific that isn’t covered by the default templates. In that case, creating a custom template is the way to go.
- Create a New Template: Go to Configuration > Templates and click on “Create template.”
- Basic Details: Give your template a name and (optionally) link it to a group.
- Add Items: Under the Items tab, add new items you want to monitor. Specify key details like key, type, and update intervals.
- Define Triggers: Go to the Triggers tab to define conditions that will represent problem states.
- Graphs and Applications: Optionally, add graphs for visual representation and group items into applications for better organization.
- Linking to Hosts: Once your template is ready, link it to your hosts just like you would with a predefined template.
Best Practices for Using Templates
- Start with Predefined Templates: Before creating a custom template, see if an existing one can meet your needs. You can modify predefined templates if necessary.
- Organize Templates Wisely: Use template groups to keep your templates organized, especially if you have a large number.
- Keep Templates Updated: As your monitoring needs change, update your templates to reflect new items or triggers.
- Use Template Inheritance: You can create a base template with common items and extend it with more specific templates. This reduces duplication.
Setting Up Basic Items and Triggers
In Zabbix, the core of monitoring any parameter, be it server load, network traffic, or application performance, revolves around two crucial concepts: items and triggers. Items are the metrics you’re monitoring, and triggers are the conditions that define when those metrics indicate a problem. Let’s break down how to set up basic items and triggers in Zabbix. 🎯📊
Understanding Items
An item in Zabbix is a data element that is monitored on a host. It could be anything from CPU load to disk space usage, from the temperature of a server room to the count of active users on a website.
Creating an Item
- Go to Host Configuration: Navigate to Configuration > Hosts and click on the host you want to add items to.
- Access the Items Section: Click on Items in the row of tabs.
- Create a New Item: Click on Create item. Here you’ll define the parameters of what you want to monitor.
- Item Details:
- Name: Give your item a descriptive name.
- Type: Choose the type of item (e.g., Zabbix agent, SNMP, JMX, etc.).
- Key: The unique identifier for the item. Some types auto-generate this.
- Data Type: Choose the appropriate data type (numeric, character, log, etc.).
- Update Interval: How often Zabbix should check this item.
- Add Additional Information: Depending on the type of item, you might need to provide more details like SNMP OID, JMX endpoint, etc.
Understanding Triggers
Triggers in Zabbix are logical expressions that evaluate data received from items and determine the state of a host. They are essential for alerting and problem detection.
Creating a Trigger
- Navigate to Triggers: From the host configuration, go to the Triggers tab.
- Create a New Trigger: Click on Create trigger.
- Trigger Details:
- Name: Enter a name that clearly describes the condition (e.g., “High CPU load”).
- Expression: Define the logical expression. For example,
{Host:cpu.load[percpu,avg1].last()} > 5might be an expression for a high CPU load trigger. This is where you refer to the items you've set up. - Severity: Choose the severity level (from Not classified to Disaster). This helps in prioritizing issues.
- Configure Further: Set up additional parameters like URLs for more information, dependencies, etc.
Best Practices for Items and Triggers
- Be Descriptive: Use clear, descriptive names for items and triggers. It’ll save you time when troubleshooting.
- Start with Basics: For your first items and triggers, start with basic system parameters like CPU load, memory usage, or disk space. As you get comfortable, you can move to more complex metrics.
- Test Your Triggers: Make sure your triggers are working as expected. You don’t want to miss critical alerts or get flooded with false positives.
- Use Templates Wisely: Remember, if you’re using a template, it might already have predefined items and triggers. Use these as a starting point.
Configuring Alerts and Actions
In Zabbix, being notified about issues promptly and effectively is crucial. This is where alerts and actions come into play. Alerts are notifications about problems or changes in your IT environment, and actions are operations executed in response to these alerts. Let’s dive into how you can configure alerts and actions in Zabbix for efficient monitoring and quick response. 🔔🚀
Understanding Alerts in Zabbix
Alerts in Zabbix are generated based on the conditions set by your triggers. When a trigger changes its state (for example, from ‘OK’ to ‘Problem’), Zabbix can send out notifications.
Setting Up Media Types
Before you can receive alerts, you need to set up media types:
- Navigate to Administration: Go to Administration > Media types.
- Configure Media Types: Zabbix supports various media types like Email, SMS, or Webhooks (for integration with services like Slack, PagerDuty, etc.).
- Edit Media Type: Select and configure the media type according to your preference. For email, you’ll need to specify details like SMTP server, SMTP email, etc.
Configuring User Media
After setting up media types, you need to associate them with user accounts:
- Go to User Settings: Navigate to Administration > Users.
- Edit User: Choose a user and go to the Media tab.
- Add Media: Specify the details like the type of alerts (Email, SMS, etc.), the address (email address, phone number), and when the user should receive alerts (time period).
Understanding Actions
Actions in Zabbix define what should happen when specific conditions (defined by triggers) occur. These can be sending out notifications, running remote commands, etc.
Creating an Action
- Navigate to Action Configuration: Go to Configuration > Actions.
- Create New Action: Click on “Create action.”
- Action Details:
- Name: Give your action a clear, descriptive name.
- Conditions: Define the conditions under which this action should be executed (like a specific trigger firing).
- Operations: Define what operations should be carried out when the conditions are met. This could include sending messages (to a user or user group) or executing remote commands.
Example: Email Notification on High CPU Load
- Name: “High CPU Load Alert”
- Conditions: Add a condition like “Trigger Name like High CPU load.”
- Operations: Add an operation to send a message via email. You can customize the message content to include detailed information about the issue.
Best Practices for Alerts and Actions
- Test Your Notifications: After setting up, test to ensure notifications are working correctly.
- Severity Levels: Use different severity levels for triggers to categorize alerts and respond appropriately.
- Clear Messaging: In your notifications, include clear and concise information about the issue, severity, and possible steps to resolve it.
- Avoid Alert Fatigue: Set up alerts wisely to avoid being overwhelmed with notifications. Focus on critical issues that require immediate attention.
Conclusion and Further Resources
Congratulations on making it through this comprehensive guide on getting started with Zabbix! 🎉 By now, you should have a solid foundation in installing, configuring, and utilizing Zabbix for effective monitoring. Remember, the journey into monitoring and network management is ongoing and constantly evolving. As you grow more comfortable with Zabbix, you’ll discover new ways to customize and scale your monitoring to suit your specific needs.
Wrapping Up
To recap, we’ve covered:
- Installation and Initial Configuration: Setting up Zabbix and getting it ready for use.
- Adding Your First Host: How to start monitoring devices in your network.
- Understanding and Using Templates: Leveraging templates for efficient monitoring.
- Setting Up Basic Items and Triggers: The core of monitoring with Zabbix.
- Configuring Alerts and Actions: Ensuring you’re alerted to issues in real-time.
- And some best practices along the way!
Further Learning and Resources
As you continue your Zabbix journey, here are some resources to help you deepen your knowledge and stay updated:
- Official Zabbix Documentation: Zabbix Manual — Your go-to resource for detailed information on every aspect of Zabbix.
- Zabbix Forums: Zabbix Forums — A great place to ask questions, share experiences, and get advice from the Zabbix community.
- Online Courses and Tutorials: Websites like Udemy, Coursera, or even YouTube have various tutorials and courses — from beginner to advanced levels.
- Zabbix Blog: Stay updated with the latest features and best practices.
- Local User Groups and Meetups: Great for networking and learning from real-world experiences.
Parting Advice
- Experiment and Explore: The best way to learn is by doing. Don’t be afraid to set up test environments and experiment with different features.
- Stay Curious: The field of network monitoring is always evolving. Keep an eye on new trends and updates in Zabbix.
- Share Your Knowledge: As you grow in your Zabbix expertise, consider sharing your experiences through blogs, forums, or even speaking at meetups.
Once again, well done on taking this important step in your journey! Remember, every large network was once a small setup, and every expert was once a beginner. Keep learning, keep experimenting, and here’s to many successful monitoring endeavors with Zabbix! 🚀🌐 Happy Monitoring!